Pch stands for ‘plotting character’ and are the symbols used to display the data points on a graph. In ggplot2 the same symbols are set with the shape argument, as shown in the guide about shapes in ggplot2.
pch symbols list
Most common symbols
The main symbols can be selected with the pch argument, with values from 0 to 25.
grid <- expand.grid(1:5, 6:1)
plot(grid, pch = 0:30, cex = 2.5,
     yaxt = "n", xaxt = "n",
     ann = FALSE, xlim = c(0.5, 5.25),
     ylim = c(0.5, 6.5))

grid2 <- expand.grid(seq(0.6, 4.6, 1), 6:1)
text(grid2$Var1[1:26], grid2$Var2[1:26], 0:25)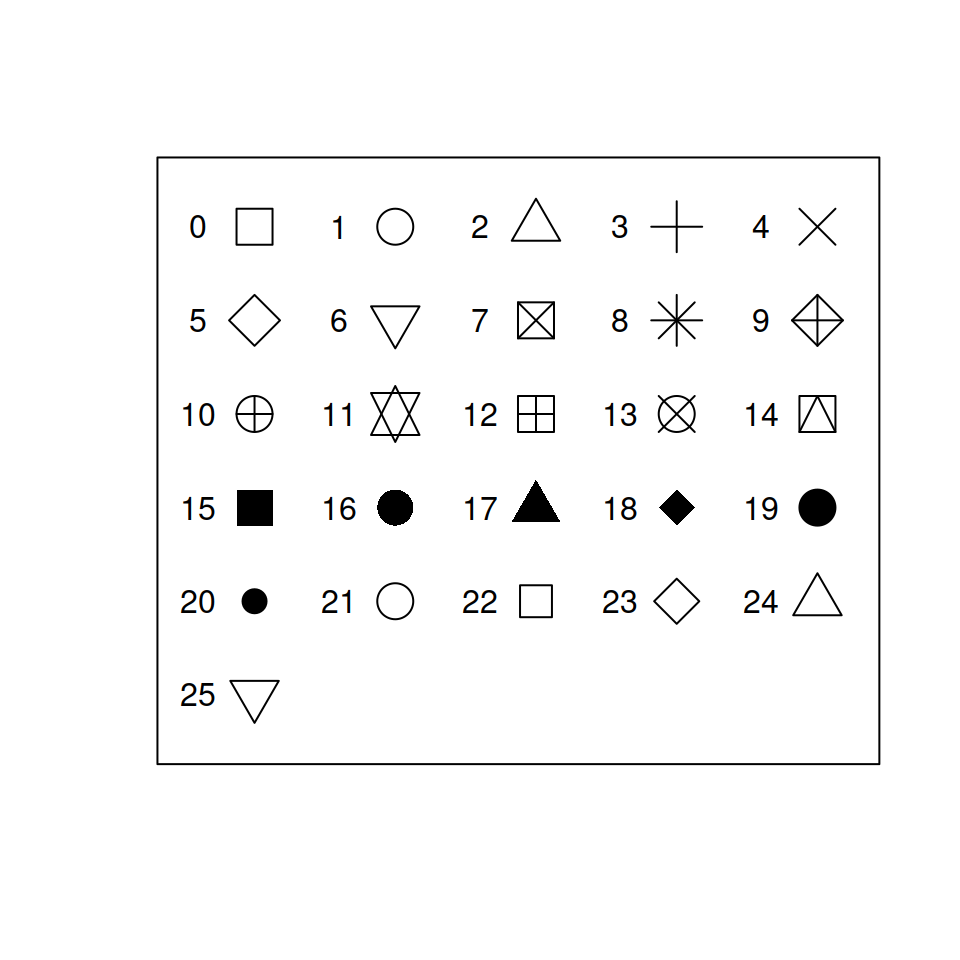
Other symbols
The rest can be specified with numbers 32 to 255, which correspond to characters. However, instead of specifying its number it’s easier to set them as a string.
# Custom symbols
plot(1:5, 1:5,
     pch = c("+", "-", "/", "&", "?"),
     cex = 2.5,
     xlim = c(0, 6), ylim = c(0, 6),
     yaxt = "n", xaxt = "n",
     ann = FALSE)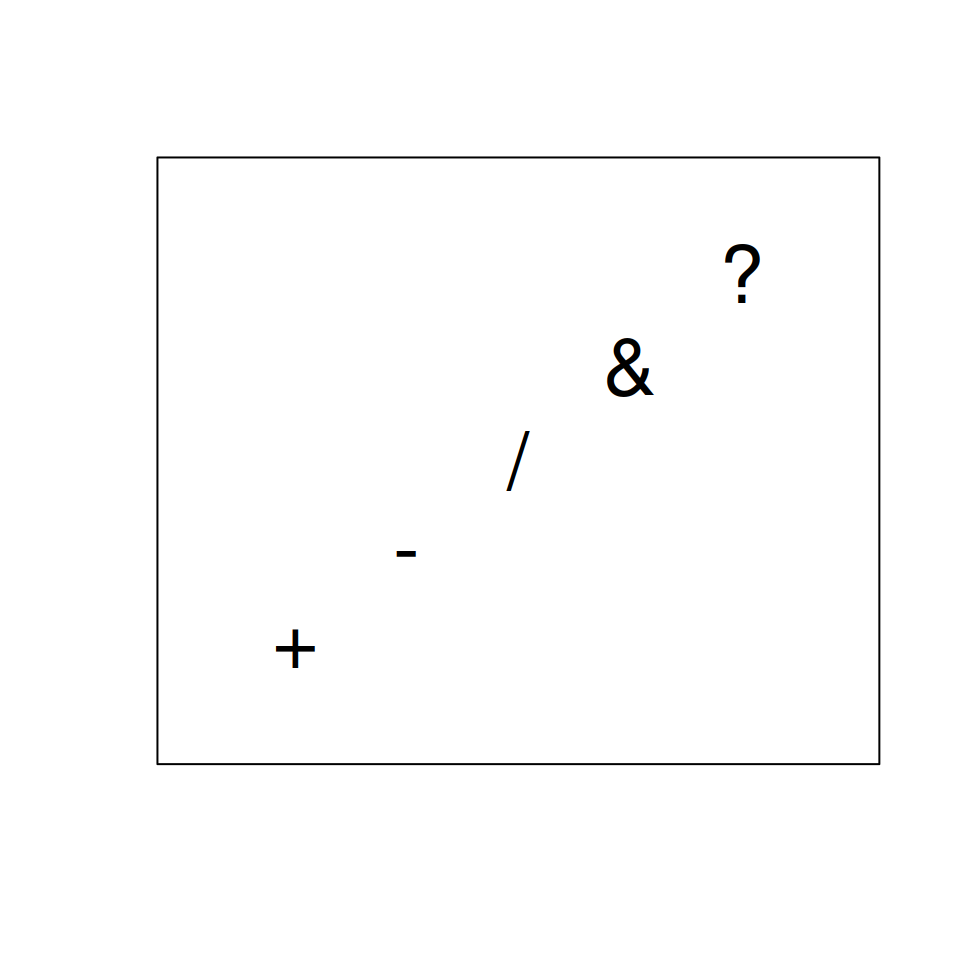
The symbols can be classified in several groups, such as:
| Symbol | Description |
|---|---|
| 0-18 | S-compatible vector symbols |
| 19-25 | Further R symbols |
| 26-31 | Not implemented |
| 32-127 | ASCII characters |
| 128-255 | Native characters |
pch colors
Color of the symbols
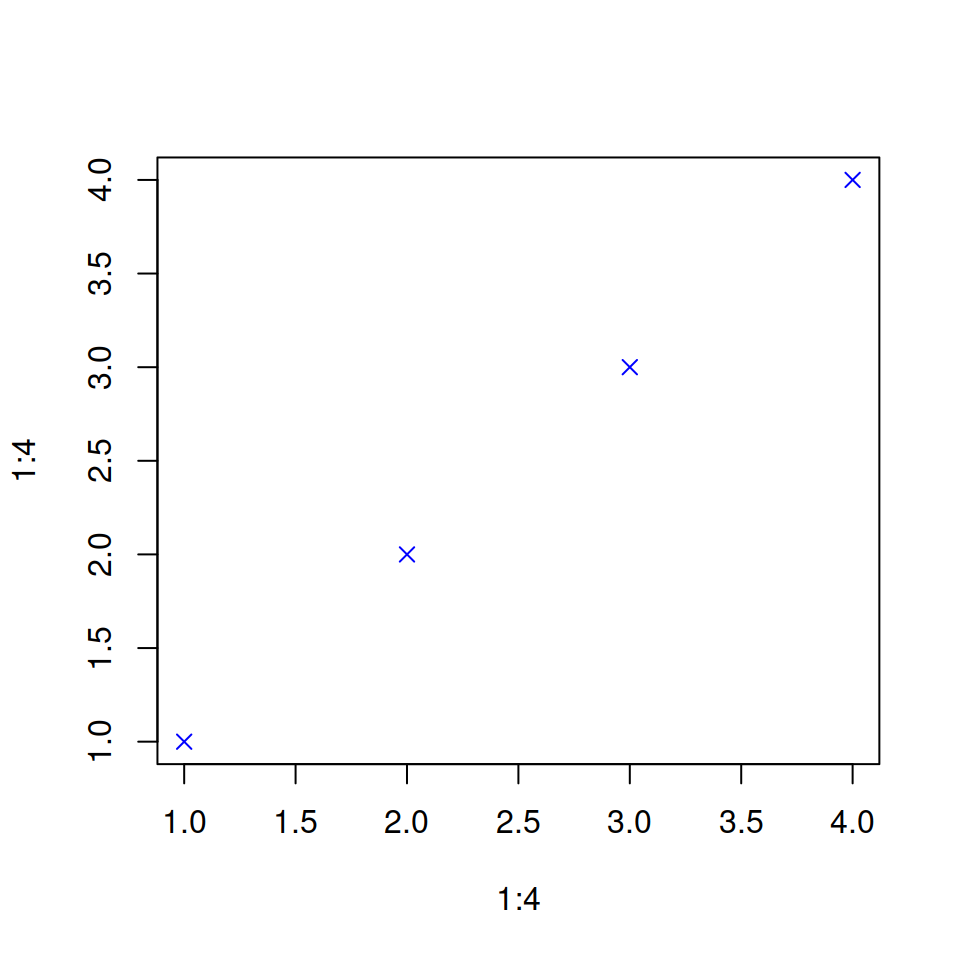
By default, pch symbols are black, but the color can be changed using col argument.
plot(1:4, 1:4,     # Data
     pch = 4,      # Symbol
     col = "blue") # Color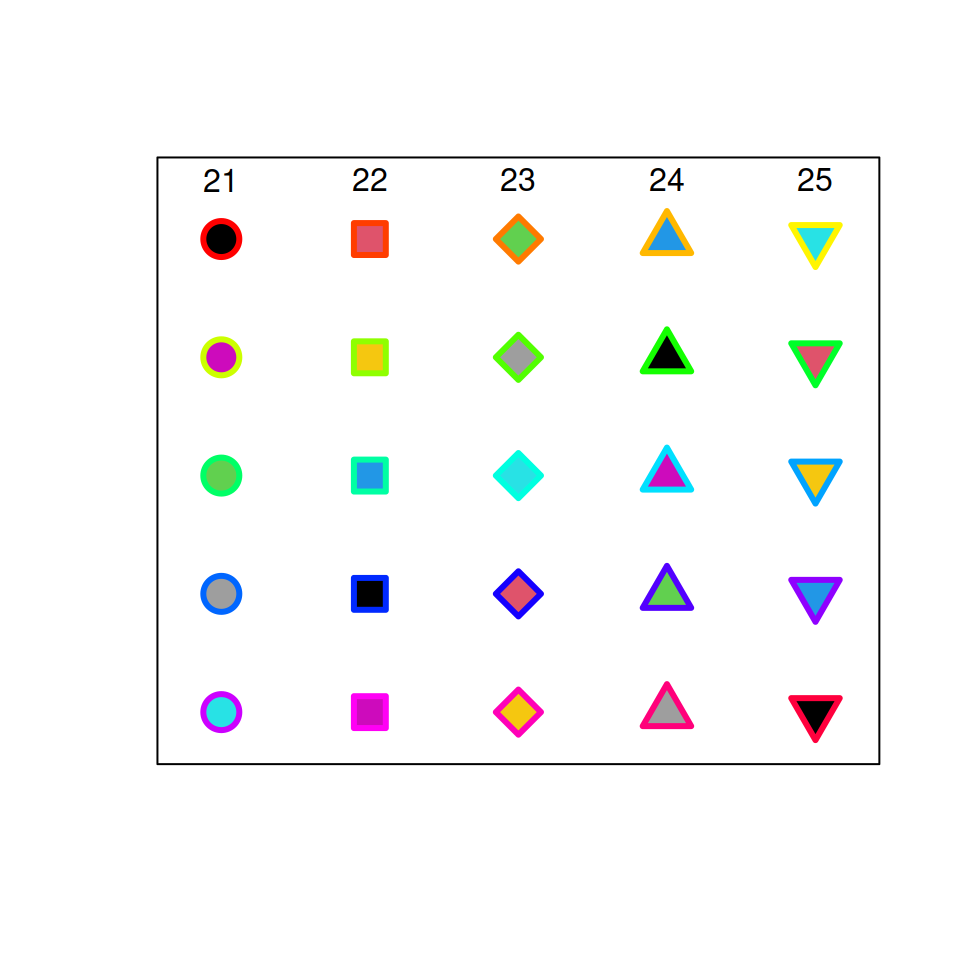
Different background color and border color
Symbols 21 to 25 also allow changing the fill color with the bg argument and the border color with the col argument.
grid <- expand.grid(1:5, 5:1)

plot(grid, pch = 21:25, cex = 2.5,
     yaxt = "n", xaxt = "n", lwd = 3,
     ann = FALSE, xlim = c(0.75, 5.25),
     ylim = c(0.75, 5.5),
     bg = 1:25, col = rainbow(25))

text(1:5, rep(5.5, 5), 21:25)
pch size
Size of the symbols
You can change the pch size in R with the cex argument. Default value is 1.
# Generate sample data
set.seed(1)
x <- rnorm(500)
y <- x + rnorm(500)

plot(x, y, pch = 21,
     bg = "red",   # Fill color
     col = "blue", # Border color
     cex = 3,      # Symbol size
     lwd = 3)      # Border width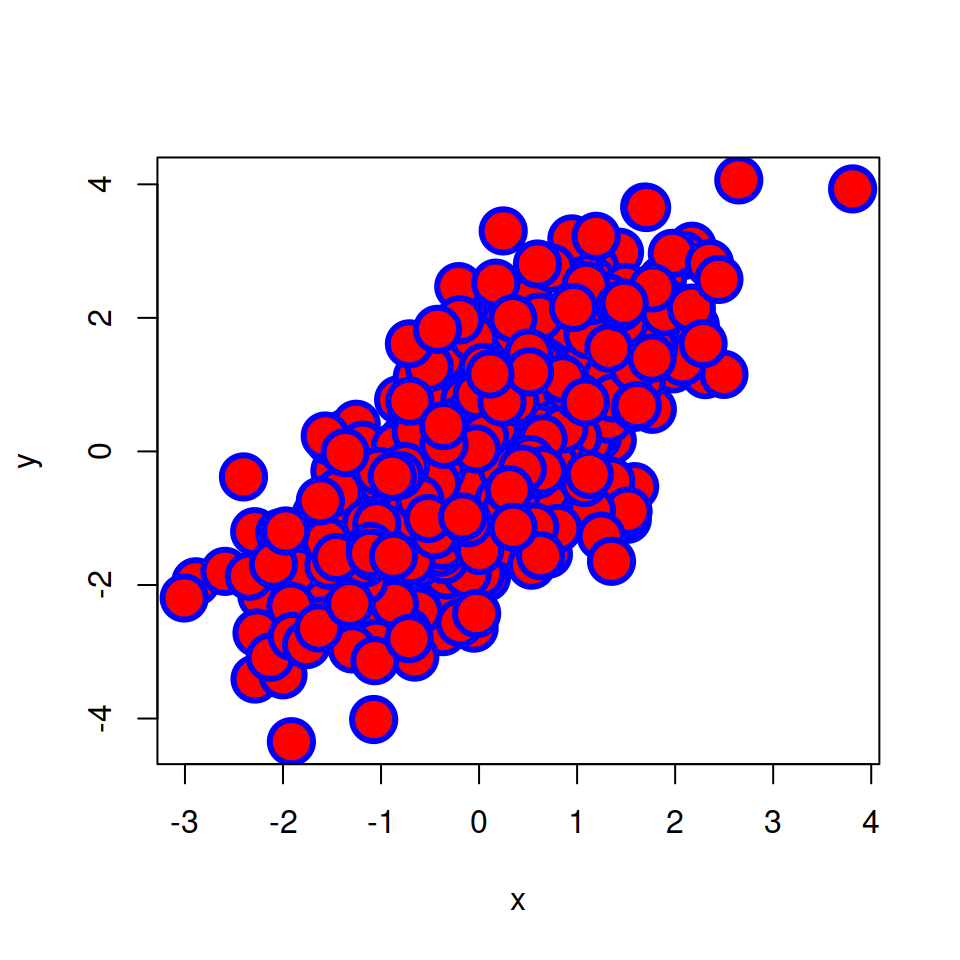
Scale the symbols
You can also set the size of the symbol based on a variable, as in the following example.
# Generate sample data
set.seed(1)
x <- rnorm(500)
y <- x + rnorm(500)

# Standardize variable Y between 0 and 1
sizes <- (y - min(y))/(max(y) - min(y))

plot(x, y, pch = 16,
     col = "blue",    # Color
     cex = sizes * 2, # Symbol size
     lwd = 3)         # Border width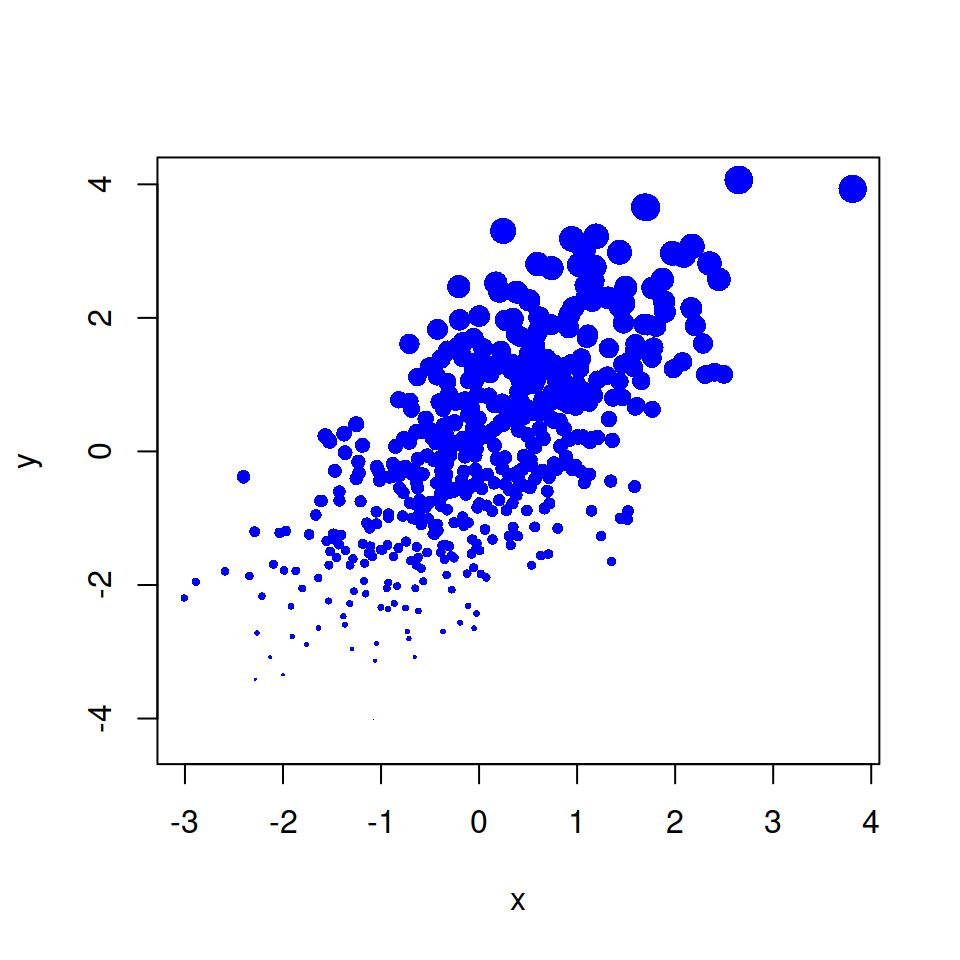
Master Statistics
Learn statistics from the basics to advanced techniques, clearly explained
Go to site